For Loops Assignment
Directions:
- Everyone does both questions
- Proper naming of Variables (variables that can tell me in the name what it is used for)
- Explain the purpose of the program by using comments at the beginning of each sketch or section of code.
- Use proper indentation of code. (Check coding standards document in Introduction to Processing Notes if you aren’t sure what proper indentation looks like.)
- Flowcharts are required
Question 1:
Celsius to Fahrenheit Table
Write a Sketch that displays a table of the Celsius temperatures 0 through 20 and their Fahrenheit equivalents. The formula for converting a temperature from Celsius to Fahrenheit is
Celsius to Fahrenheit Table
Write a Sketch that displays a table of the Celsius temperatures 0 through 20 and their Fahrenheit equivalents. The formula for converting a temperature from Celsius to Fahrenheit is
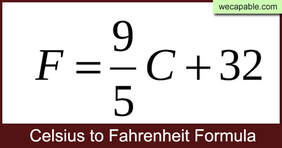
Where F is the Fahrenheit temperature and C is the Celsius temperature. Your Sketch must use a loop to display the table. Round to 2 decimal places.
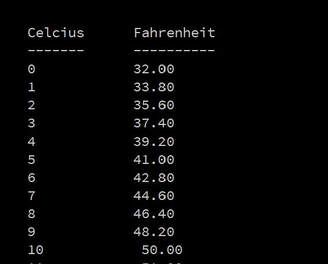
Sample Output:
Sample Output:
Question 2:
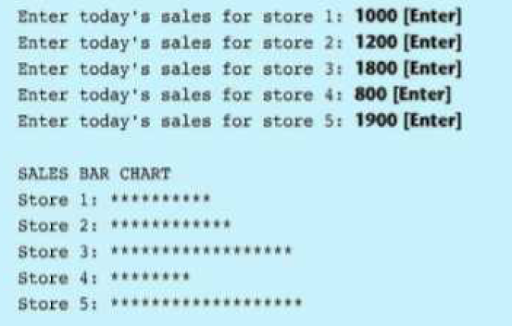
Bar Chart:
Write a Sketch that user a for loop and asks the user to enter today’s sales for five stores. The Sketch should display a bar chart comparing each store’s sales. Create each bar in the bar chart by displaying a row of asterisks. Each asterisk should represent $100 of sales. Here is an example of the Sketch’s output: